


Right now I am looking at what’s around me.
I think in terms of probabilities. I observe all the facts and put them together to come to an objective conclusion which guides my positioning.
I do not believe in being bullish or bearish. I also can be bullish and bearish at the same time.
This is a collection of charts and what they look like right now. No words, Just charts. You can come to your own conclusions.
Before, I want to add some context with whats going on right now:
Many companies that are reporting stellar earnings are dropping 10-20%+
We are still at war with Iran
Yields skyrocketing globally
S&P500 (Perspective)
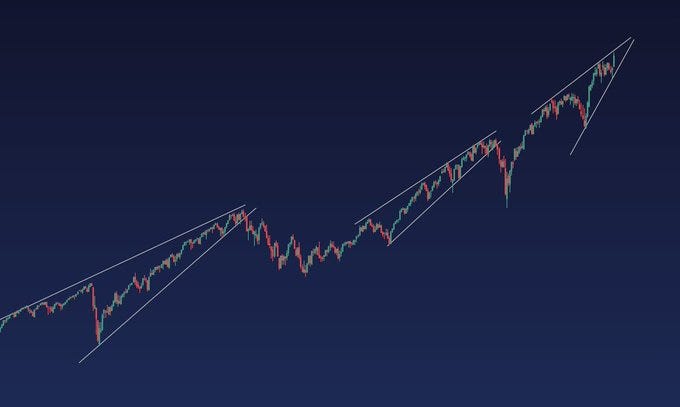
HYG - Junk Bonds
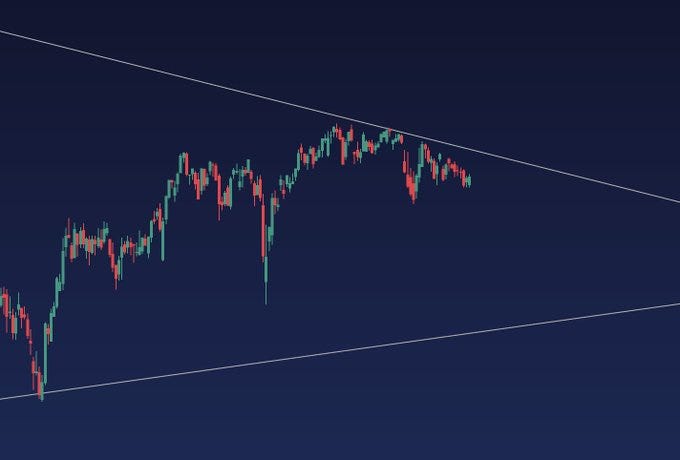
XLY - Consumer Discretionary
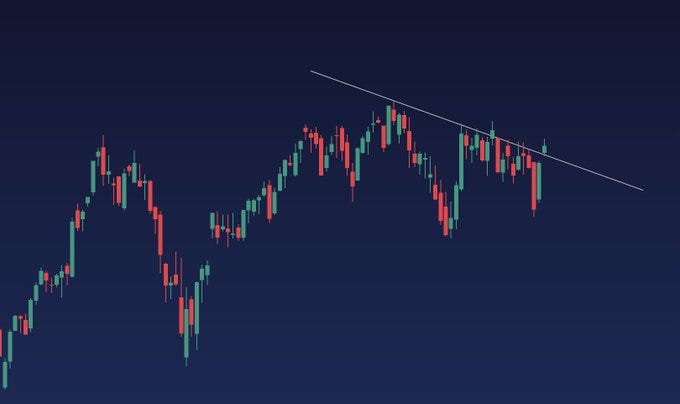
IGV - Software
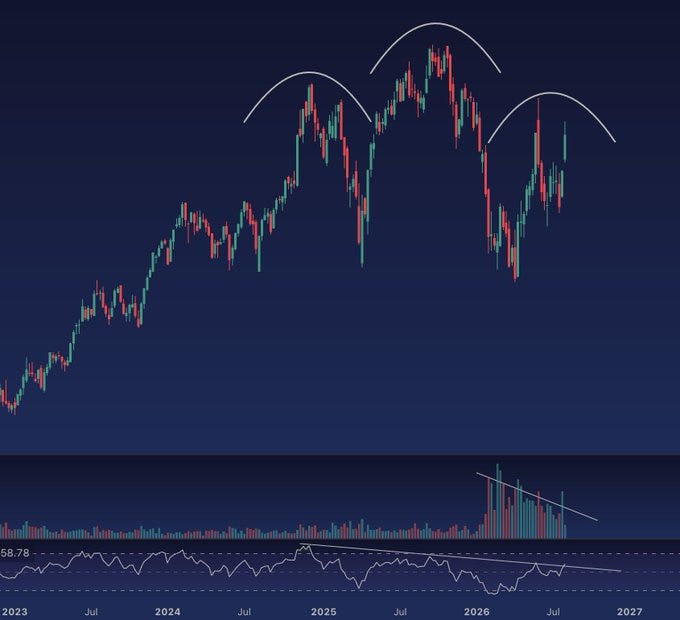
KRE - Regional Banks
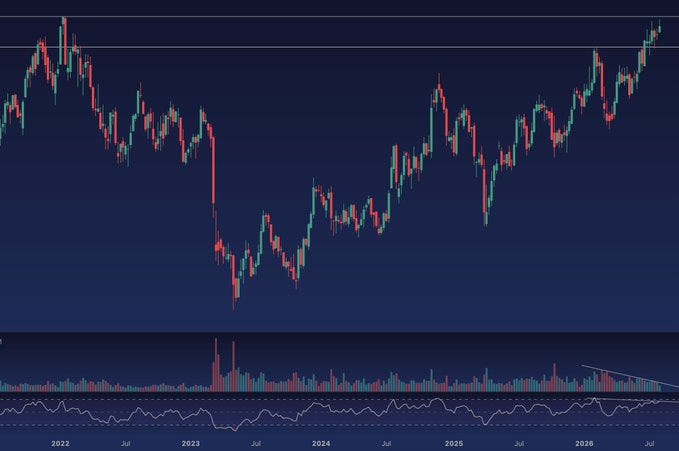
FXI - Large Cap China
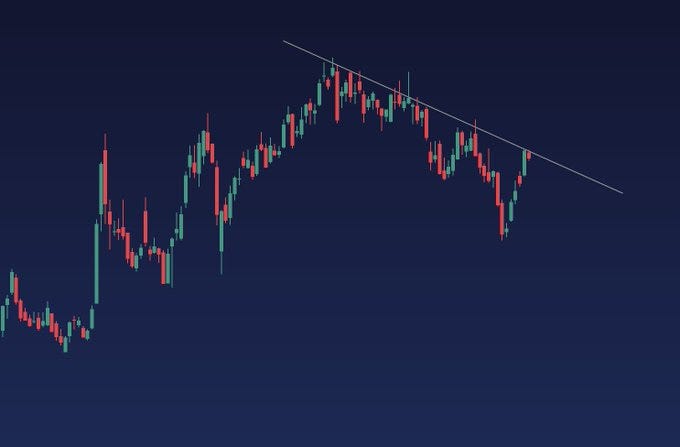
MEME - Fintwit Faves
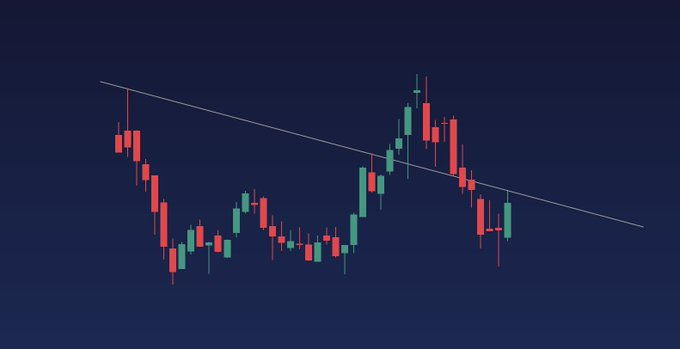
SOX - Semiconductors
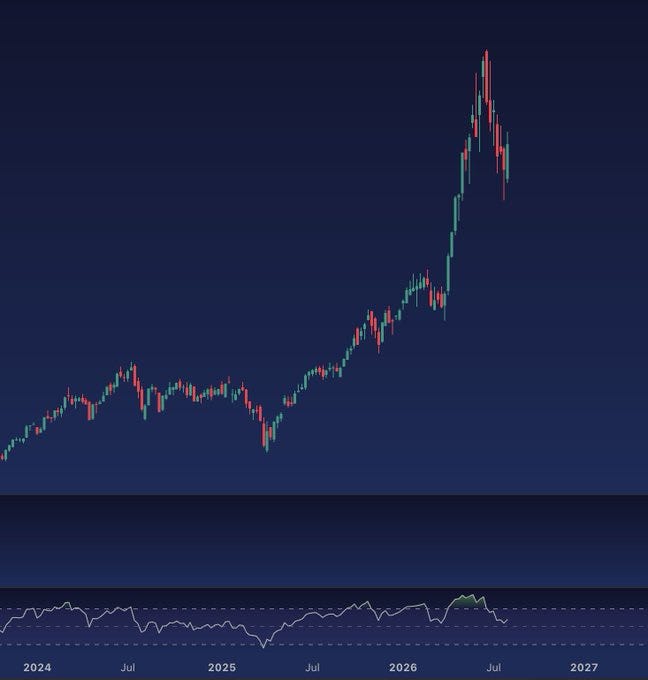
TLT - Long Duration Treasuries
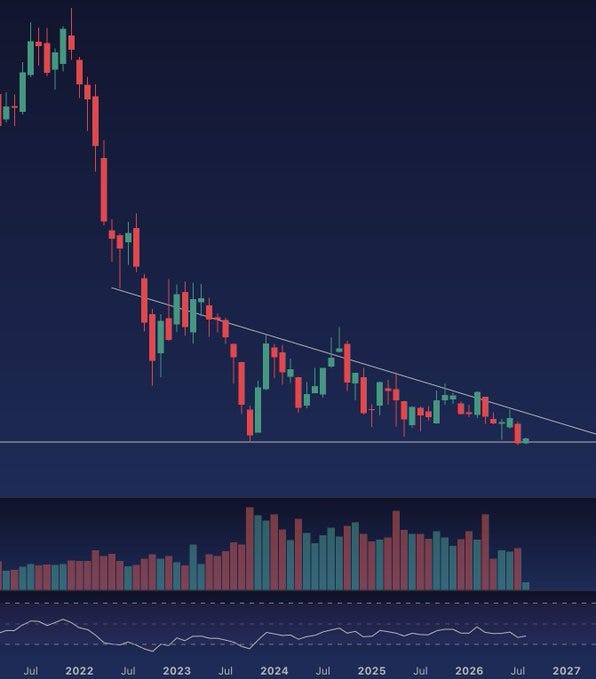
QQQ
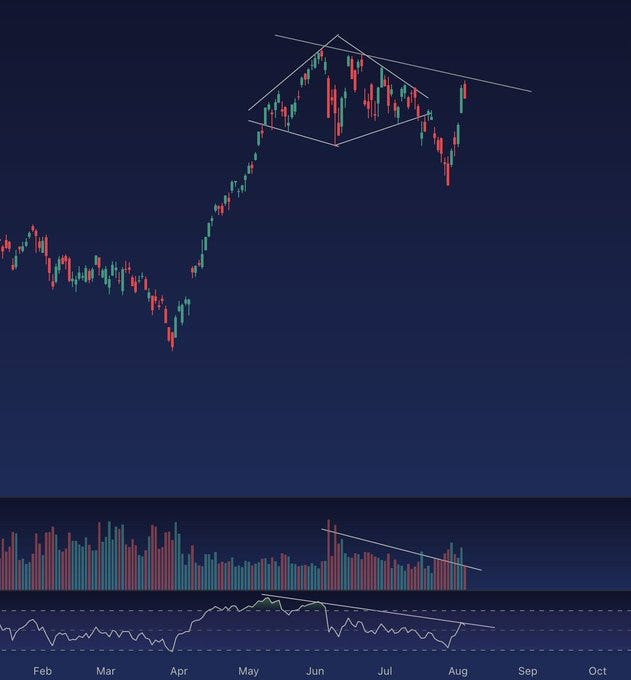
Gold
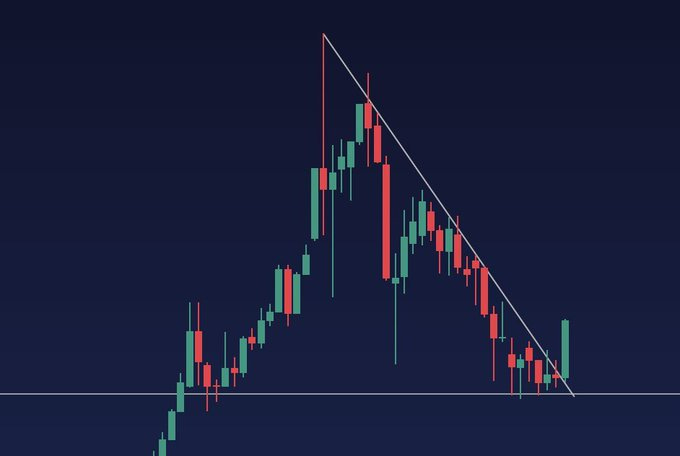
BTC - Bitcoin
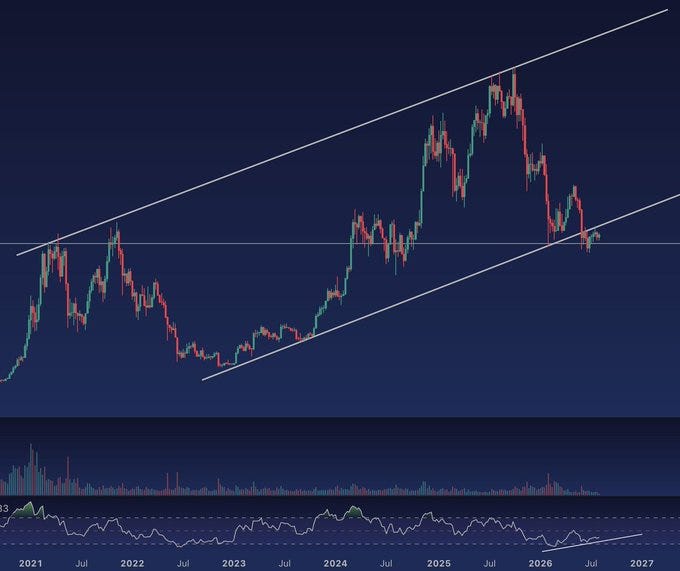
XBI - Biotech
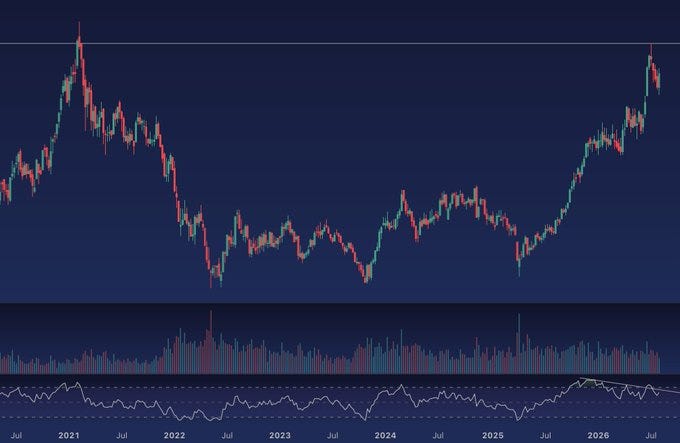
XHB - Homebuilders
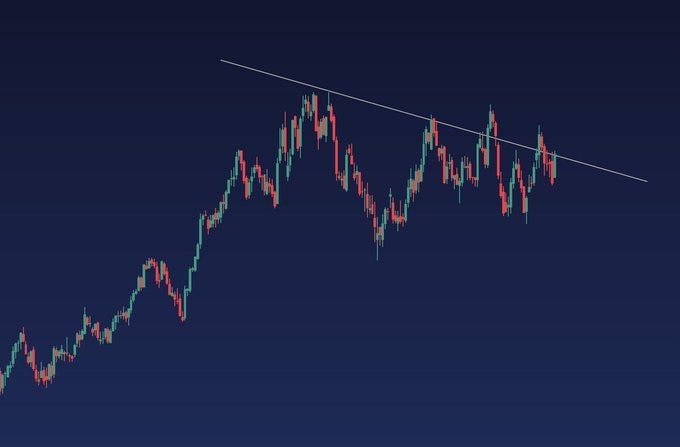
XLRE - Real Estate
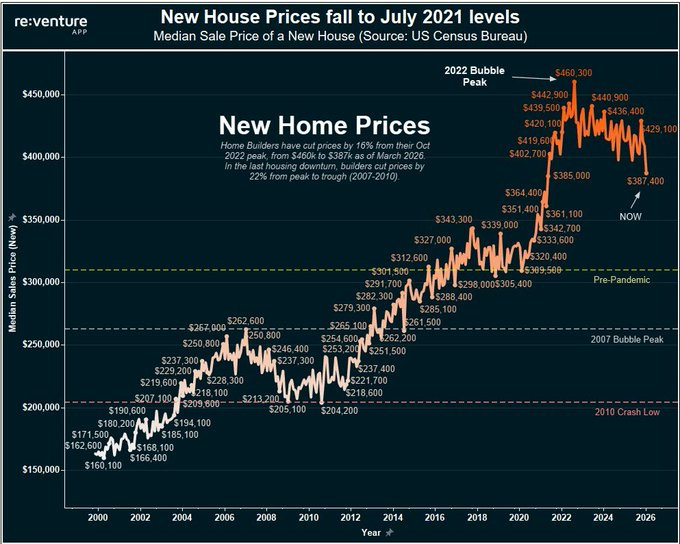
Bonus Chart - New Home Prices
This report is published for informational and educational purposes only. It is not, and should not be construed as, investment advice, a recommendation, an offer to sell, or a solicitation of an offer to buy any security.
If you are an accredited investor and interested in investing in Outlier Capital, please reach out at matt@outliercapitalmanagement.com or on the contact form on the website.